I mostly use R Statistical Software for my research. In some ocasions I have developed small applications of R for my research projects. Here I leave some examples of them.
| Municipality Results on the 2016 Presidential Elections in Chile | (last update: Dec 27, 2017) |
|---|---|
 |
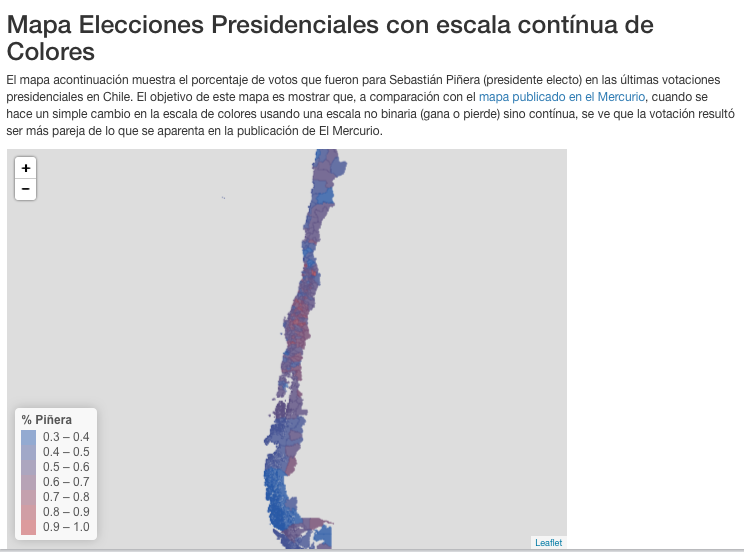
Motivated by the very interesting results of the last presidential elections in Chile. At the Center for Economics and Regional Policy (CEPR) of the Adolfo Ibáñez University we came up with a new map to showcase the election results. This project was initially motivated by a map published by El Mercurio Newspaper in Chile which painted with red those counties that were won by Sebastian Piñera (center-right candidate), and with blue those counties won by the oposing candidate Alejandro Guillier (center-left candidate). Although this is a common practice in countries like the U.S., where winner-take-all system is in place (candidate wins the whole state electorate college votes), in Chile that is not the case. In Chile, the popular vote is the system that defines who wins as president. Hence we wanted to map using a color scale that represents this continuos metric across the territory. |
| GoogleDataSearch R package | (last update: Oct 14, 2016) |
|---|---|
 |
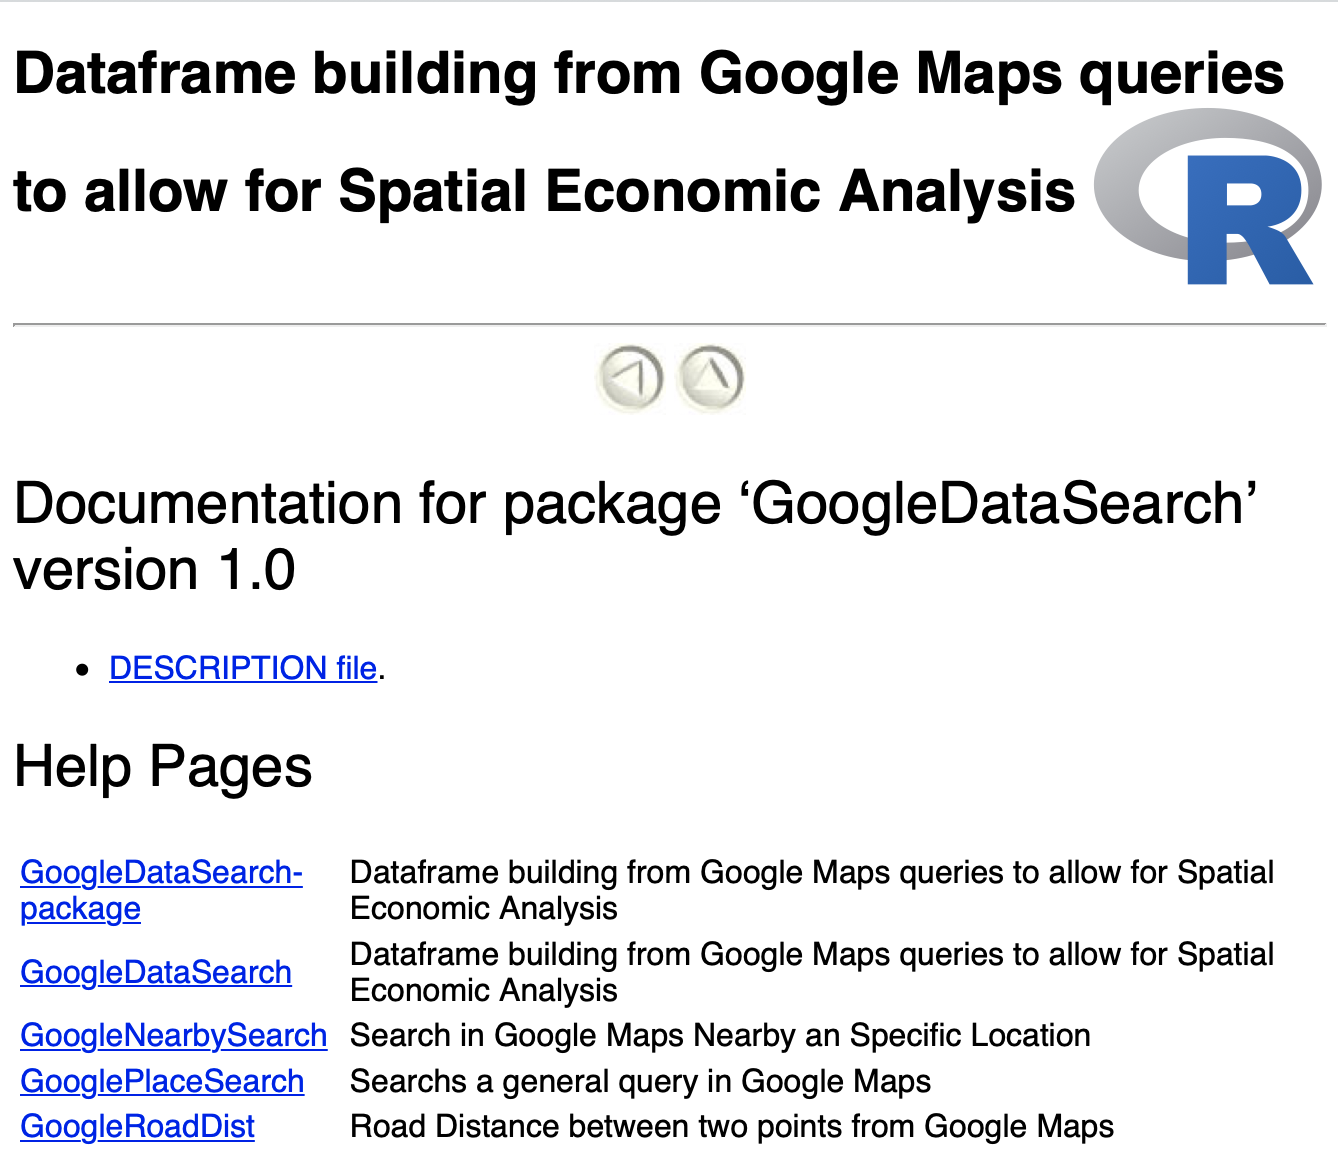
GoogleDataSearch is a small package to build data sets from GoogleMaps queries using R. The package is still under its beta version. However it can still be used. The GoogleDataSearch R package can be installed from GitHub at: https://github.com/estebanlp/GoogleDataSearch |
| The REAL Network - 25th Anniversary | (last update: Nov 9, 2014) |
|---|---|
 |
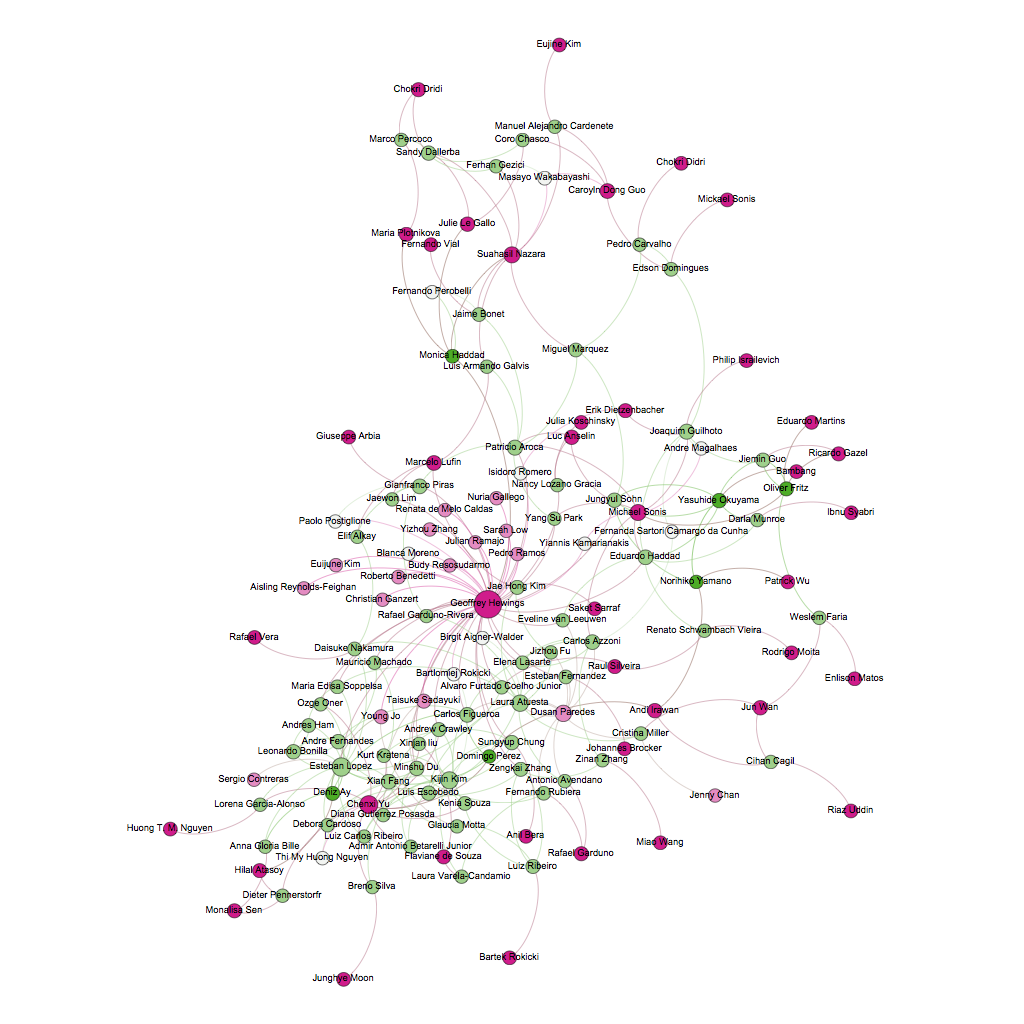
During my time as the REAL General at UIUC under the command of my advisor Geoffrey Hewings, I conducted a small survey of the REAL alumni and present students and fellows (better know as the REAL Mafia) to assess how REAL has spurred friendship and academic collaboration. This small project resulted in a very interesting application of the use of R as a tool for both doing the analysis and the interactive presentation using Slidify. The codes and the presentation slides are available in GitHub. |